
April 2021 - Monthly Market Update
/Monthly Update || April 2021
“When things are going well and prices are high, investors rush to buy, forgetting all prudence. Then, when there’s chaos all around and assets are on the bargain counter, they lose all willingness to bear risk and rush to sell. And it will ever be so.”
Opening Remarks
Greetings from inside Ikigai Asset Management¹ headquarters in Marina del Rey, CA. We welcome the opportunity to bring to you our thirty-first Monthly Update and hope these are helpful in better understanding some of what we’re doing and what we’re seeing. We have the privilege of deploying capital on behalf of our investors into a new technology and asset class that we believe will fundamentally change the world and create trillions of dollars of value in the process.
We believe we are obligated to be shepherds of this technology – to help the world better understand the powerful potential of DLT and crypto assets, and to fund and be an ambassador for DLT projects that will change our lives forever.
To that end, we find ourselves nearly seven months into an absolutely raging bull market for crypto broadly and Bitcoin specifically. The blistering pace of Bitcoin price appreciation, up another 31% and March and a stunning 498% since early September has barely been able to keep up with the positive news flow, which saw strong continuation in March. BTC price is 52% up from the day before Elon announced his BTC purchase, and ~20% up from the day before the Tether NYAG settlement. Let me be straightforward here – that is cheap.
It’s cheap for a lot of reasons - not least of which is that this run does not appear close to being over, neither in price nor in time. That might be somewhat hard to get your head around when you just look at this chart.

Source: TradingView. As of 3/30/21.
How could a chart that looks like that still be considered cheap? Well, look below at the March Highlights. And go back through the Highlights of prior Monthly Updates. Everything has changed for Bitcoin. Quickly. Then, consider this chart.

Source: FRED. As of 3/30/21.
And then consider the outlook. Both the outlook for Bitcoin (and crypto broadly) and the outlook for monetary and fiscal policies. Is more institutional capital going to flow into Bitcoin? Is Bitcoin going to get even easier and safer to own? Will more products be introduced that make Bitcoin available to more pools of capital? Will more corporates, both public and private, buy Bitcoin on their balance sheets? Will Gary Gensler eventually approve a Bitcoin ETF? Will Bitcoin downside volatility become easier to hedge? Is Bitcoin more investable at $1tn market cap than it was at $100bn? Will it be more investable at $2tn than $1tn? Will the world consider Bitcoin a better store of value the more value it stores?
What about the outlook for monetary and fiscal policies? Where are those heading?
Source: NYT. As of 3/22/21.

Source: CNBC. As of 3/30/21.
Will the Fed’s balance sheet continue to expand? Will M2 money supply continue to grow above historical norms? Will nominal interest rates stay subdued? If nominal interest rates grow too rapidly, will the Fed implement explicit yield curve control? How serious is the Fed about generating CPI inflation? Will Treasury and Congress help generate inflation with their fiscal policies? Does the US have any other choice besides defaulting on its debt or inflating it away? Are most other developed nations in a worse spot than the US? Are all central banks racing to see who can devalue their currency the fastest?
These are some of the questions to contemplate when evaluating Bitcoin at $59,000. Bitcoin is a non-sovereign, hardcapped supply, global, immutable, decentralized, digital store of value. It is an insurance policy against monetary and fiscal policy irresponsibility from central banks and governments globally. And it is cheap here.
Invest
Ikigai is currently fielding interest from new investors globally. We are open to international and qualified accredited U.S. investors (including self-directed IRAs).
Contact us to see if you qualify.
March Highlights
$4tn AUM Morgan Stanley Private Wealth Management to Offer NYDIG and Galaxy BTC Funds to Clients
NYDIG Raises $200mm From Morgan Stanley, New York Life, MassMutual, Soros
Visa to Enable Bitcoin Purchases at 70mm Merchants
One River Adds Former SEC Chair Jay Clayton as Advisor
Fireblocks Raises $133mm Series C from Coatue, Ribbit, BNY Mellon
MicroStrategy Purchases $15mm BTC at $45,710, $10mm BTC at $48,888 and $15mm BTC at $57,146
Hong Kong-listed Software Company Meitu Purchases $50mm ETH and $39mm BTC on Balance Sheet
Beeple Sells NFT for $69mm, Third Highest Sale from Living Artist Ever
Norwegian Oil Billionaire Kjell Rokke Buys $58mm BTC, Launches Bitcoin Business
Tether Produces Reserves Attestation from Moore Cayman
FTX Purchases Naming Rights to Miami Heat Stadium for $135mm
Visa Launches Pilot with Crypto.com to Settle USDC on Visa Network
BlockFi Raises $350mm Series D at $3bn Valuation
Goldman Restarts Crypto Desk, To Offer New Crypto Products
CBOE Files to List VanEck ETF, Starts Clock for SEC to Respond
State Street Named Fund Administrator and Transfer Agent for VanEck ETF
Fidelity, Goldman, SkyBridge, NYDIG, VanEck, Valkyrie, WisdomTree and Bitwise All Have Current Bitcoin ETF Applications Pending
PayPal Acquires Crypto Custodian Curve, Launches “Checkout with Crypto”
Crypto Tax Company TaxBit Raises $100mm Series A from Paradigm and Tiger Global
Dapper Labs Raises $305mm Led by Coatue
Grayscale Parent Digital Currency Group Announces $250mm GBTC Buyback Program
Binance Adds Former US Senator and Ambassador to China Max Baucus as Advisor
Coinshares IPOs on Swedish Stock Exchange
Jerome Powell Says Bitcoin Is More Like Gold Than the Dollar
Howard Marks Changes His Mind About Bitcoin
China Said to Clamp Down on Inner Mongolia Bitcoin Mining Activities
CFTC Fines Coinbase $6.5mm for 2015-2018 False Reporting and Wash Trading
FATF Release Draft 2021 Crypto Guidance
| Asset Class | Mar | Feb | Jan | YTD | Q4-20 | Q3-20 | Q2-20 | 2020 | Instrument |
|---|---|---|---|---|---|---|---|---|---|
| Bitcoin | 31% | 36% | 14% | 103% | 169% | 18% | 42% | 303% | BTC |
| NASDAQ | 2% | 0% | 0% | 2% | 13% | 12% | 30% | 48% | QQQ |
| S&P 500 | 4% | 3% | -1% | 6% | 12% | 8% | 20% | 16% | SPX |
| Total World Equities | 3% | 3% | 0% | 5% | 15% | 8% | 19% | 14% | VT |
| Emerging Market Equity | -1% | 1% | 3% | 3% | 17% | 10% | 17% | 15% | EEM |
| Gold | -1% | -6% | -3% | -10% | 1% | 6% | 13% | 25% | GLD |
| High Yield | 1% | -1% | 0% | 0% | 4% | 3% | 6% | -1% | HYG |
| Emerging Market Debt | -1% | -3% | -2% | -6% | 5% | 2% | 13% | 1% | EMB |
| Bank Debt | 0% | 0% | 0% | -1% | 2% | 2% | 4% | -2% | BKLN |
| Industrial Materials | 0% | 11% | -2% | 8% | 14% | 11% | 10% | 16% | DBB |
| USD | 3% | 0% | 1% | 4% | -4% | -4% | -2% | -7% | DXY |
| Volatility Index | -31% | -15% | 45% | -15% | -14% | -13% | -43% | 66% | VIX |
| Oil | -2% | 17% | 7% | 23% | 17% | 1% | -17% | -68% | USO |
Source: TradingView. As of 3/31/21.
The Everything Bubble
There’s a story from David Foster Wallace that goes like this - there are these two young fish swimming along, and they happen to meet an older fish swimming the other way, who nods at them and says, “Morning, boys. How’s the water?” And the two young fish swim on for a bit, and then eventually one of them looks over at the other and goes, “What the hell is water?”
Ask a 24-year-old financial analyst, who was 12 the first time the US did Quantitative Easing, if we’re in an asset price bubble. Then ask a 74-year-old professional investor the same question. You’re likely to get two very different answer. The former hasn’t experienced much of the world at all, and that whole time it’s only been one way. While the latter has seen much more. Now, certainly the young analyst could pull up a chart like this-

Source: multpl.com. As of 3/30/21.
And see that stock prices appear to be quite elevated by historical standards. But if you asked the young analyst if she wanted to sell stocks, she’d likely say no, because stocks only go up. And then she’d pitch you a couple weed stocks, a couple EV stocks and tell you to get an allocation to ByteDance when it IPOs.
Our young analyst could also pull up a chart like this-

Source: multpl.com. As of 3/30/21.
And see that debt prices are also very elevated by historical standards. But then if you asked the young analyst if she wanted to sell bonds, she’d likely….well this is where the story breaks down because young people think debt investing is boring. But the point is, if you’ve only been paying attention for a decade or so, stocks only go up, yields only go down, and Every. Single. Dip. is a buying opportunity.

Source: TradingView. As of 3/30/21.
Why has that been the case? Because we’re in an everything bubble. And that everything bubble can be overwhelmingly attributed to one singular trend…

Source: Yardeni.com. As of 3/30/21.
QE makes asset prices go up. It doesn’t cause headline CPI price inflation, or at least not a lot of it. But it makes asset prices go up. And if QE is accompanied by loose fiscal policy (like we’re just now starting to see), there’s a good chance we’ll see headline CPI inflation as well. But for now, it’s mostly been asset prices. Specifically, the prices of assets that are only accessible and desirable to the wealthy have seen inflation. Stocks are for rich people. The wealthiest 1% of Americans own 52% of all equities, and the wealthiest 10% own 87%. The higher up the Cantillon Effect ladder you are, the more you’ve seen prices rise for assets you want. You’re seeing that play out everywhere.
Yet, for as much as the SPX has increased in the last decade, the aggregate value of the Top 10 sports franchises has gone up even more.
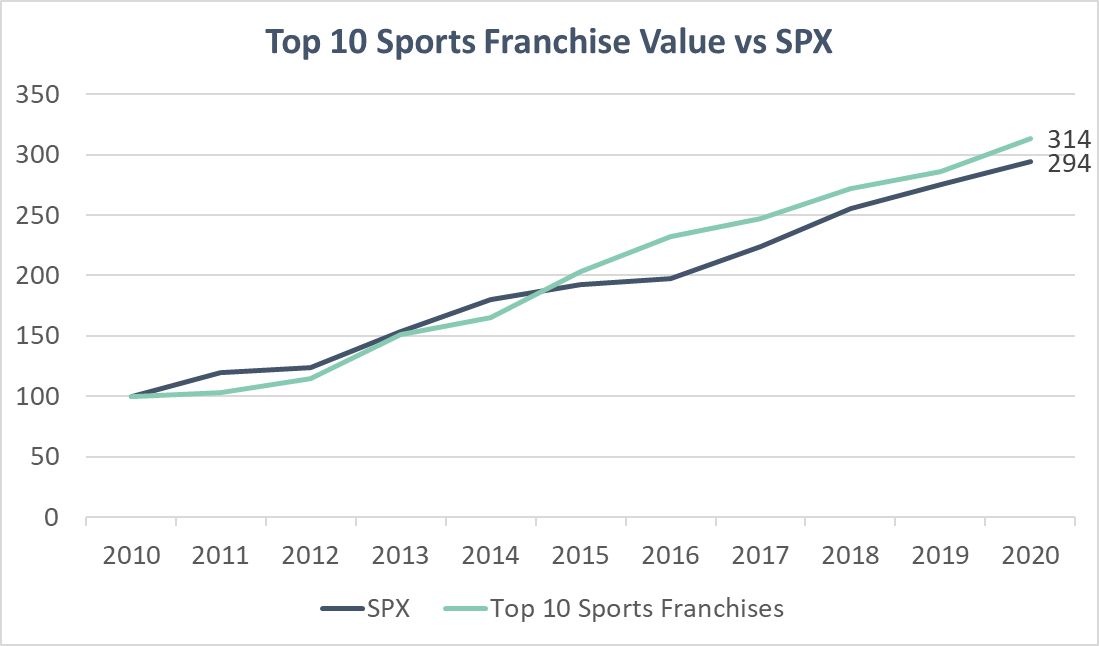
Source: Forbes. As of 3/30/21.
Fine wines have only been in-line with the S&P 500 over the last five years, but that’s probably just because rare whisky’s have absolutely crushed.

Source: Liv-ex and rarewhisky101. As of 3/30/21.
Classic Ferraris are well off their highs of a few years ago, likely as a function of EV’s and ESG, but the asset class has still kept up with the S&P 500.

Source: Hagerty.com. As of 3/30/21.
It’s true you would’ve made more money buying tech company stocks than homes for tech company workers, but SF real estate has been quite a nice place to park cash, especially considering you borrowed the cash at 4% to pay for it.

Source: FRED. As of 3/30/21.
Super Bowl tickets as an asset class? Absolutely crushed.

Source: thestreet.com. As of Jan 2020.
Video games? Winner.

Source: Statista. As of 1/29/21.
Hermes handbags? Winner.

Source: AMR. As of March 2020.
You’re seeing it everywhere. What’s going on? Artificially low interest rates and the “Fed put” have pushed capital further out on the risk curve in search of higher returns, while taking comfort that things can’t really get that bad because the Fed will be there with a tsunami of liquidity.
That setup has led the average size of seed stage venture capital deals to double in the last five years, even as the cost to start a business has declined.

Source: Tracxn. As of 3/18/21.
But that’s nothing compared to later stage VC deals, which have exploded in size over the last six years.

In fact, no matter how you want to slice it, venture capital has gone full gong show as the central bank printing presses have gone brrrr.

Where else can we see crystal clear signs of the Everything Bubble?

How about “companies that can’t pay the interest on their debt with cash flow generated by the business?”

What about some more recent trends that hit a little closer to home? Beeple sold a JPEG for an amount that makes it the third highest selling artwork EVER by a living artist. Is that a bubble?

Source: WSJ. As of 3/11/21.
The aggregate value of NFT platform tokens is worth 2x more than Squarespace. Is that a bubble?

Source: Forbes. As of 3/29/21.
The aggregate DeFi market cap is worth more than UBS and Barclays combined. Is that a bubble?

Source: Coingecko. As of 3/31/21.
Filecoin’s fully diluted market cap is 34x larger than Dropbox. Cardano’s market cap is larger than Twitter. Dogecoin is worth a billion bucks. Are those bubbles?
Which brings us to our final chart. The non-sovereign, hardcapped supply, global, immutable, decentralized, digital store of value.

Source: Tradingview. As of 3/31/21.
Nine cents to $59,000 in under 11 years and heading higher. Is THAT a bubble? I think it depends on how you define a bubble. If the last 12 years of the chart below looked like the first 90 years of that same chart, the chart above wouldn’t look anything like it does.

Source: FRED. As of 3/24/21.
If the chart above didn’t look like that, good chance Bitcoin wouldn’t have a chart at all because it would be a science experiment that only a couple thousand cyberpunks and distributed systems enthusiasts cared about. You wouldn’t be sitting here reading this and I wouldn’t be sitting here writing this.
If the last 12 years of this chart looked like the first 100, Bitcoin’s chart wouldn’t look anything like it does.

Source: FRED. As of 10/16/21.
But this is the world we’re living in right now and the outlook for monetary and fiscal policies is what it is. So stocks are running hot. Bonds are running hot. Sports franchises are running hot. Wine and whisky running hot. Ferraris. Super Bowl tickets. San Fran housing. Video games. Venture Capital. Hermes purses. Blank check companies. Zombie companies. JPEGs on the blockchain. Finance on the blockchain. Vaporware on the blockchain. IT’S ALL RUNNING HOT.
And as for the hardest money in human history? Well it’s running the hottest of them all. The fastest horse, if you will. As well it should be. Bitcoin appears to have been purpose-built for a time such as this. A perfect mirror reflection of monetary and fiscal policy irresponsibility. Money printer go brrr and number go up.
At this point most of the world has taken notice, yet less than 1% of the population owns any at all. But they CAN. Anyone can. Bitcoin doesn’t sit out of reach for the vast majority of the human population like stocks, whisky, Ferraris, luxury real estate, venture capital and Hermes purses all do. Anyone in the world with an internet connection can buy $1 worth of Bitcoin and begin protecting themselves against monetary debasement and the rapidly increasing risk that the largest monetary experiment in human history will end poorly. Bitcoin is for the people and that is a beautiful thing.
Market Update – Liquid Crypto Asset Investing
| Symbol | March | February | January | YTD | Q4-20 | Q3-20 | Q2-20 | Q1-20 | 2020 | 2019 |
|---|---|---|---|---|---|---|---|---|---|---|
| BTC | 31% | 36% | 14% | 103% | 169% | 18% | 42% | -11% | 303% | 92% |
| ETH | 36% | 8% | 78% | 161% | 105% | 59% | 69% | 3% | 469% | -3% |
| XRP | 39% | -16% | 124% | 162% | -9% | 38% | 1% | -10% | 14% | -45% |
| BCH* | 19% | 11% | 10% | 45% | 31% | 5% | -1% | 26% | 71% | 30% |
| EOS | 39% | 19% | 12% | 85% | 1% | 9% | 6% | -14% | 1% | 0% |
| BNB | 45% | 373% | 18% | 712% | 27% | 90% | 22% | -8% | 172% | 123% |
| XTZ | 43% | 20% | 41% | 142% | -9% | -7% | 46% | 20% | 49% | 192% |
| XLM | 2% | 33% | 138% | 222% | 71% | 12% | 64% | -10% | 184% | -60% |
| LTC | 20% | 27% | 4% | 59% | 169% | 12% | 6% | -5% | 202% | 36% |
| TRX | 97% | 44% | 18% | 236% | 2% | 61% | 41% | -13% | 101% | -29% |
| Aggregate Mkt Cap | 36% | 39% | 29% | 146% | 122% | 32% | 44% | -5% | 301% | 51% |
| Aggregate DeFi* | 43% | 44% | 113% | 338% | 41% | 164% | 217% | 9% | 1177% | 77% |
| Aggr Alts Mkt Cap | 44% | 45% | 65% | 245% | 56% | 58% | 45% | 4% | 274% | -1% |
Source: CoinMarketCap. As of 3/31/21. BCH includes SV. Aggregate DeFi from Coingecko.
The first quarter of 2021 will go down in the history books as one of the most bullish periods ever for crypto broadly and Bitcoin specifically. In March, Bitcoin put up its 6th consecutive positive monthly price performance. And while monthly cutoffs are just arbitrary numbers, it is worth noting BTC price has never increased seven consecutive months before. That said, my base is we’ll break that record in April.
After initially briefly breaking the monumental $1tn market cap level in late February, Bitcoin solid off into the end of Feb before rallying back through the $1tn level in the first two weeks of March, selling off again below the $1tn mark and then rallying through it once again to close the month out 10% above.

Source: Tradingview. As of 3/31/21.
While it’s certainly too early to say for sure, there is a real chance sub-$1tn Bitcoin could be a thing of the past. This price action around $1tn though is notable. The initial break up. The pullback. The higher high. The pullback bottoming at a higher low. The impending higher high. That looks like acceptance. Whoever was in the mood to sell BTC at $1tn has done so, and that supply looks to be running out. This setup bodes well for Q2.
If BTC has indeed put a floor in at $1tn and is heading higher, that puts it in rare company versus every other currency on the planet. Warning – if you haven’t been paying attention, the chart below may shock you.

Source: fiatmarketcap.com. As of 3/31/21.
Yes, you’re reading that right. If Bitcoin increases 10%, it will be worth more than the Swiss Franc. Let that sink in.
Macro mostly stayed out of the way for crypto in March, as opposed to January when GameStop came into play and February when rates came into play. “It’s all one trade” saw a continued bifurcation in March that first emerged in late Feb.

Source: Tradingview. As of 3/31/21.
Rates higher. Yield curve steeper. BTC running with SPX. DXY (inverted) stronger and running with CNH and EEM. Oil was running with rates and pulled back to match BTC and SPX. That’s the story at the moment. What does it all mean? In short, I think it means the market is expecting CPI inflation. CPI inflation is about to hit some very easy Y/Y comps, which will make the headline inflation Y/Y percentages look pretty big. While that’s going on the market will be assessing the outlook for inflation in the back half of 2021 and 2022. Much of that assessment will be focused on how much fiscal is done and how that money actually gets spent (or doesn’t). Then inflation expectations will be adjusted accordingly and that will show up in the chart above. In any case, at the moment I am expecting the Macro backdrop to be exceedingly supportive of Bitcoin in the coming months, although that can always change in a hurry.
Bitcoin has experienced three pullbacks YTD. Notably, each has been increasingly smaller in percentage terms than the prior. This, along with many other quantitative and qualitative measures, is indicative of accumulation.

Source: Tradingview. As of 3/31/21.
Reflexivity plays a pivotal role in defining the characteristics of these pullbacks. While we are firmly in an upwardly reflexive cycle, the depth of the pullbacks gets set by the *marginal* buyer who is *most* bullish on BTC’s future. This reflexive setup is currently being exacerbated by the large inflow of institutional capital into BTC – some of which is just now buying for the first time and some of which is trying to add to its existing small position.
It’s like a long line to get in somewhere everyone wants to be with ticket prices at the door that rapidly increase to meet real-time demand. The ticket price keeps going up, then when the ticket price declines slightly because there’s a pause in demand to get in, whoever wants to get in the most puts the bottom in on the price. And the upward trajectory continues.
We can’t talk about Bitcoin without mentioning it’s YTD underperformance relative to ETH - +103% vs +161%. That trend has continued over from 2020 where ETH outperformed BTC 469% to 303%. Now even after all that outperformance, ETHBTC is currently still 78% below its ATH. That’s honestly astonishing. That’s how bad ETH got smoked in the bear market. Does ETH have room to run vs BTC? Yes, I think it does. The EIP-1559 upgrade + Optimism scaling makes for easily digestible catalysts that could drive significant ETH outperformance in the near term.
The main underlying driver of ETH outperformance, the same underlying driver for the need to scale, is DeFi. And DeFi has massively outperformed ETH YTD, up 388% vs ETH’s 161%. That comes on the back of totally insane outperformance in 2020, up 1,177% vs ETH +469%. The speed of innovation and the sheer number of projects in DeFi is more work than a single full-time dedicated analyst can cover. But it doesn’t take a full-time analyst to look at this chart.

Source: Defipulse. As of 3/31/21.
Or this one.

Source: Defipulse. As of 3/31/21.
All of DeFi’s outperformance this year came in the first 38 days, and the DeFi Index has been consolidating/flagging against BTC for nearly two months – having pulled back 28% from it’s high vs BTC.

Source: Tradingview. As of 3/31/21.
Is it my base case that DeFi will break higher versus BTC this year? Yes. Would it make sense for that to happen either immediately before or immediately after ETH breaks out? Yes it would. Do I think DeFi, and in turn ETH has room to run vs BTC in the coming months? Yes I do. Do I think ETH and DeFi may very well outperform BTC all the way up? Yes I do. But don’t be fooled. Bitcoin is giving ETH and DeFi *permission* to run. They don’t call it the King for nothing. It’s all fun and games when BTC is trending up. Don’t get caught holding the bag on the other side though. You don’t want to be stuck being “in it for the tech” on some tech you don’t know anything about that no one ends up actually using. Remember, it’s not innovation that’s being rewarded with market value, it’s just QE. Proceed with caution.
Over to Bitcoin, spot is increasingly being purchased and pulled out of the pool of available supply. Much of that will not be for sale anywhere close to current prices.

Source: Glassnode. As of 3/31/21.
Bitcoin open interest reached a new ATH at the ATH in price before pulling back along with price and the bouncing again into month-end.

Source: Bybt. As of 3/31/21.
While the $22bn of open interest may seem like a lot at face value, it must be considered against Bitcoin’s $1.1tn market cap. That 2% ratio is actually less than the 2.5% on September 1st. Yes, the Bitcoin derivatives market is growing rapidly, but it is commensurate with increase in the value of the underlying.
The Canadian Bitcoin ETF stacked ~6,000 BTC in its first full month of operations and now holds more than $1.2bn worth. Don’t sleep on our neighbors to the north.

Source: Glassnode. As of 3/31/21.
Hashrate hit a new ATH in March. This is bullish.

Source: Blockchain.com. As of 3/31/21.
Bitcoin 30-day realized price volatility peak on Feb 8th and has been declining since. Note that peak was middle of the pack for prior mid-cycle peaks. Right down the middle of the fairway for where we should be.
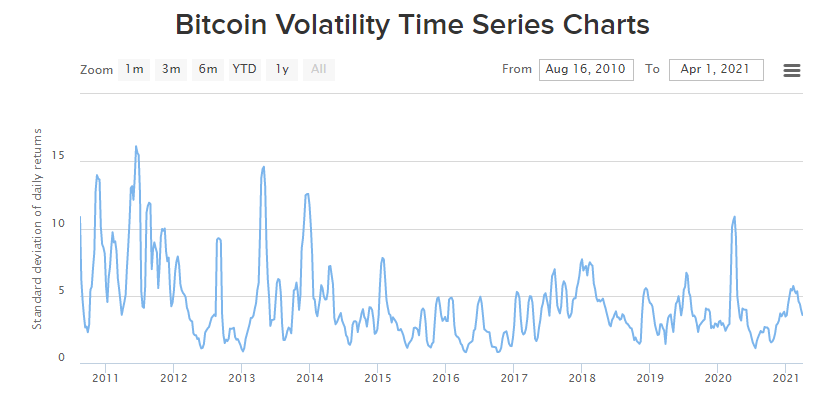
Source: buybitcoinworldwide.com. As of 3/31/21.
The percent of all Bitcoin that has moved in the last year bottomed in September 2020 and has been heading higher since.

Source: Glassnode. As of 3/31/21.
At first glance, you’ll notice that prior cyclical tops have been marked by lower highs of BTC moved in the last year. Even with that said, there is a ton of room to run even assuming a lower high this cycle in BTC moved in the last year. Note that in the last cycle, price increased 47x from the point at which the % of BTC held for one year bottomed and headed higher. Even if you only get half that 47x from the bottom in one year held Bitcoin this cycle, that will still put price above $240k for this cycle’s top. Or maybe Bitcoin just does something it’s never done before. Which is certainly possible.
Reserve Risk, a proprietary metric we first introduced in May 2019, shows us we are right on schedule and looking very similar to the 2017 run. Depending on how you want to interpret this, a price peak for this cycle could easily breach $200k.

Source: Ikigai. As of 3/31/21.
Looking at the chart below in a vacuum would tell you price needs to consolidate for a bit. Two months of flat price would help. Three months would be ideal. Unclear if we’ll get it, when, or from what price.

Source: lookintobitcoin. As of 3/31/21.
Many on-chain indicators look at least somewhat overheated here. If your assumptions are that this cycle is going to look like 2017, we need a multi-month period of consolidation. That could totally happen. Although dying on the hill of “this cycle’s on-chain footprint has to look like last cycle’s on-chain footprint” is not a great idea and not something we’re going to do. So we’ll take it as it comes, level by level, incorporating our proprietary quantitative signals in conjunction with our qualitative overlay, and manage risk accordingly. Same thing we’ve been doing since September 2019. Regardless of how this cycle plays out and the market opportunities presented now or in the future, our focus remains on actively managing risk and reducing downside volatility. Successfully accomplishing that means our Partners gain exposure to the potential asymmetric returns this asset class offers ... all while being able to sleep easy at night knowing the team at Ikigai is working to protect and grow their capital.
Closing Remarks
Does it feel good? It should. We’re making history. Right this second. At absolute worst, we get to be involved in the most earthshattering Tulip Mania the world has ever seen. At best, we get to be in on the ground floor of the next world reserve currency and one whose monetary policy is not controlled by man, but by open-source software code. HOW AWESOME IS THAT?
What if we *actually* pull off Web 3 and rebuild the whole thing on top of public distributed ledger architecture? No more AWS. Just a bunch of Layer 1’s with use-case specific functionality, all communicating seamlessly with one another. No more Dropbox. Just Filecoin. No more YouTube. Just LivePeer. No more ISPs. Just Helium. No more Twitter. Just Bitclout. No more NYSE. Just DEX’s. No more banking. Just DeFi.
Is that my base case? To be honest, I don’t know. My job doesn’t really force me to think about the world like that. If you’ve been reading these for a while, you know I feel drastically more confident about Bitcoin’s outlook than the rest of it. But the rest of it could come to fruition too. Or if it’s not the projects I just listed, it will be their successors. Maybe it’s not this cycle we really bring all this stuff to the world, but it’s 2025. I’m not sure. But we’ll be here for it. And that sure is exciting.
“Dumplings over flowers”
– Japanese Proverb
Travis Kling
Founder & Chief Investment Officer
Ikigai Asset Management
P.S.
Included below is an incomplete list of memorable tweets from the last month. Twitter is not investment advice and my views could easily be wrong. That being said, like it or not, Twitter matters for crypto. I have no interest in being a talking head for a living and babbling about on Twitter is a long way away from being a good steward of investor capital. However, this is a community with open-source software in its DNA, and participants want to crowd-source the truth. We are shepherds of this technology. Answers to fundamental questions about this asset class are not currently clear, so having a public platform to share your views with the community is important. After all, you’re helping shape the future :)
1. Ikigai Asset Management is the trade name for a collection of advisory and consulting businesses operated by Travis Kling, Anthony Emtman, and their team.
The information contained or attached herein is not intended to provide, and should not be relied upon for, accounting, legal or tax advice or investment recommendations. This presentation may contain forward-looking statements that are within the meaning of Section 27A of the Securities Act of 1933 and Section 21E of the Securities Exchange Act of 1934. These forward-looking statements are based on management’s beliefs, as well as assumptions made by, and information currently available to, management. Although management believes that the expectations reflected in these forward-looking statements are reasonable, it can give no assurance that these expectations will prove to be correct. This email is for informational purposes only and does not constitute an offer to sell, or the solicitation of an offer to buy, any security, product, service of Ikigai as well as any Ikigai fund, whether an existing or contemplated fund, for which an offer can be made only by such fund’s Confidential Private Placement Memorandum and in compliance with applicable law. Past performance is not indicative nor a guarantee of future returns. Please consult your own independent advisors. All information is intended only for the named recipient(s) above and is covered by the Electronic Communications Privacy Act 18 U.S.C. Section 2510-2521. This email is confidential and may contain information that is privileged or exempt from disclosure under applicable law. If you have received this message in error please immediately notify the sender by return email and delete this email message from your computer. Copyright 2021 Ikigai Asset Management, LLC. All Rights Reserved.
NOT INVESTMENT ADVICE; FOR INFORMATION ONLY
PAST PERFORMANCE IS NOT A GUARANTEE OF FUTURE RESULTS
