
October 2022 - Monthly Market Update
/Monthly Update || October 2022
“A hugely profitable investment that doesn’t begin with discomfort is usually an oxymoron.”
Opening Remarks
Greetings from Ikigai Asset Management¹ headquarters. We welcome the opportunity to bring to you our forty-ninth Monthly Update and hope these are helpful in better understanding some of what we’re doing and what we’re seeing. We have the privilege of deploying capital on behalf of our investors into a new technology and asset class that already has and will continue to fundamentally change the world – continuing to create trillions of dollars of value in the process.
We believe we are obligated to be shepherds of this technology – to help the world better understand the powerful potential of DLT and crypto assets, and to fund and be an ambassador for DLT projects that will change our lives forever.
To that end, as has mostly been the case for many months now, crypto was entirely beholden to the ominous clouds hovering over the macro landscape. It’s not that there’s not anything going on in crypto. Quite the opposite. There are all kinds of things going on at the moment. But as it relates to price action, macro has dominated micro. The correlation remained as stifling in September as it has most of the last 11 months, although there was a noteworthy divergence in the last 10 days of the month-

Source: TradingView. As of 9/30/22.
It’s too early to make a decoupling call here, as there are many macro factors currently at play – topics we discuss in detail below. Q4 is setting up to be an important one.
In the meantime, the much-hyped Ethereum Merge came…and then mostly went. ETH was -15% in September vs BTC -3% and NASDAQ -11%. With price performance like that, you might have thought there were problems with the Merge. On the contrary. The Merge went off flawlessly. Since the Merge, ETH hasn’t quite lived up to its “deflationary” moniker due to relatively low levels of blockchain activity, but it’s not far off.

Source: ultrasound.money. As of 9/30/22.
So technically, the Merge was a major success. It’s just that macro was shitting the bed and that overwhelmed the positive outcome of the event. ETH price declined 19% from the September 15th Merge into month-end, significantly underperforming BTC and NASDAQ, down 4% and 9% over the same time.
Last month I said,
“You might bet that with the upcoming Merge for Ethereum, at least ETH could decouple from the chokehold of the NASDAQ. But honestly I don’t love that bet. For as big of a narrative as the Merge is (I believe it’s the most significant catalyst in crypto history), if traditional markets are in turmoil, it would be my base case the positive price impact from the Merge would be delayed at best and cancelled at worst.”
So that’s how it turned out. And now here we are. With the Merge behind us, macro risks significantly advanced, and the near-term outlook is not great at all. At some point, I think the positivity of a successful Merge will show up in ETH price action. But for now, it appears there are bigger fish to fry.
Invest
Ikigai is currently fielding interest from new investors globally. We are open to international investors and qualified accredited U.S. investors (including self-directed IRAs).
We accept new investors on the 1ˢᵗ and 15ᵗʰ of every month.
Contact us to see if you qualify.
September Highlights
Ethereum Merge Successfully Completed
ETH PoW Hard Fork Occurs, Trades From $32 to $6 and Back to $12
FTX Acquires Voyager Digital for $111mm
Modular Execution Layer Fuel Labs Raises $80mm Led by Blockchain Capital
Facebook’s Libra Project Spinout Sui Raises $300mm at >$2bn Led by FTX, a16z, Jump, Binance, Coinbase, Circle and Lightspeed
Lightning Network Startup Strike Raises $80mm from Ten31, Washington University of St Louis and University of Wyoming
Reddit Founder Alex Ohanion Leads $54mm Raise into Doodles NFTs
Fraud Protection Startup Sardine Raises $51mm Series B Led by a16z
Game Developer Theorycraft Raises $50mm Series B Led by Makers Fund
African Exchange Yellow Card Financial Raises $40mm Series B Led by Polychain
Trading Platform 3Commas Raises $37mm Series B Led by Target Global, Alameda Research and Jump Capital
Messari Raises $35mm at $300mm Valuation Led by Brevan Howard Digital
Deribit Raises $40mm at $400mm Valuation from Existing Investors
FTX Ventures Acquires 30% of Skybridge Capital
London Asset Manager Fasanara Capital Launches $350mm Web3 VC Fund
NEAR Partners with Caerus Ventures on $100mm Ecosystem Fund
MSTR Initiates $500mm Common Stock Offering, Purchases $6mm of Bitcoin
Kraken CEO Jesse Powell Resigns
Celsius CEO Alex Mashinsky Resigns
FTX US President Brett Harrison Resigns
South Korea Issues Arrest Warrant for Do Kwon
SEC Charges Ian Balina for Promoting Unregisted ICO’s
Crypto Market Maker Wintermute Hacked for $160mm
Major Bitcoin Mining Pool Poolin Suspends Withdrawals from Wallet Service
Abra Launches “Abra Bank” and “Abra Boost” Staking and Yield Products
CME Launches ETH Options
NASDAQ Planning to Offer Crypto Custody and Other Services
Helium Network Signs 5-year Agreement with T-Mobile
CFTC Charges Ooki DAO with Multiple Violations
California and New York Issue Order for Nexo to Cease Offering of Yield Products
| Asset Class | Sep | Aug | July | Q3-22 | Q2-22 | Q1-22 | YTD | Q4-21 | Q3-21 | Q2-21 | Q1-21 | 2021 | 2020 | Instrument |
|---|---|---|---|---|---|---|---|---|---|---|---|---|---|---|
| Bitcoin | -3% | -14% | 18% | -2% | -57% | -2% | -58% | 6% | 25% | -41% | 103% | 60% | 303% | BTC |
| NASDAQ | -11% | -5% | 13% | -5% | -23% | -9% | -33% | 11% | 1% | 11% | 2% | 27% | 48% | QQQ |
| S&P 500 | -9% | -4% | 9% | -5% | -16% | -5% | -25% | 11% | 0% | 8% | 6% | 27% | 16% | SPX |
| Total World Equities | -10% | -4% | 7% | -8% | -16% | -6% | -27% | 5% | -2% | 6% | 6% | 16% | 14% | VT |
| Emerging Market Equity | -12% | -1% | 0% | -13% | -11% | -8% | -29% | -3% | -9% | 3% | 4% | -5% | 15% | EEM |
| Gold | -3% | -3% | -3% | -8% | -7% | 6% | -10% | 4% | -1% | 3% | -10% | -4% | 25% | GLD |
| High Yield | -4% | -5% | 6% | -3% | -11% | -5% | -18% | -1% | -1% | 1% | 0% | 0% | -1% | HYG |
| Emerging Market Debt | -7% | -3% | 3% | -7% | -13% | -10% | -27% | -1% | -2% | 3% | -6% | -6% | 1% | EMB |
| Bank Debt | -4% | 0% | 3% | 0% | -7% | -1% | -9% | 0% | 0% | 0% | -1% | -1% | -2% | BKLN |
| Industrial Materials | -8% | -1% | 1% | -8% | -25% | 16% | -20% | 8% | 2% | 8% | 8% | 29% | 16% | DBB |
| USD | 3% | 3% | 1% | 7% | 7% | 3% | 17% | 1% | 2% |
-1% | 4% | 6% | -7% | DXY |
| Volatility Index | 22% | 21% | -26% | 10% | 40% | 19% | 84% | -26% | 46% |
-18% | -15% | -24% | 66% | VIX |
| Oil | -11% | -6% | -3% | -19% | 8% | 36% | 20% | 34% | 5% | 23% | 23% | 64% | -68% | USO |
Source: TradingView. As of 9/30/22.
VaR Shock Potpourri
Last month I said,
“There’s a pile of risk present at the moment. It’s hard not to be bearish in the coming months given the macro backdrop. The weight of QT, a global recession and a dollar wrecking ball could easily grind asset prices down through year-end. Or something more cataclysmic could happen suddenly and it could be a vicious down move followed by the Fed stepping in and putting in a bottom. There’s good reason to believe that the Fed “tightening until something breaks” is becoming increasingly more likely. That could mean asset prices may soon find a bottom, but it could be a seriously rocky road to get there. Or we could somehow thread a needle and avoid a half dozen distinct landmines and asset prices could head higher into year-end, crypto included. At the moment it’s hard to have that as your base case though.”
Fast forward just thirty days and the backdrop has become meaningfully more ominous. September was a rough month for macro and the punches came from numerous directions. I believe the readers of these Monthly Updates are looking for my view on the most impactful macro events as it relates to crypto. So in that spirit, the below is a relatively concise list of relevant macro situations that matter for crypto.
UK Gilt Crisis and Yield Curve Control
Nord Stream Pipeline Attack
Ukraine Conflict Escalation
EU & UK Natural Gas Crisis
Yen Intervention
Yuan Intervention
Dollar Wrecking Ball/DXY Milkshake
Fed Tightening & US Inflation
Public Company Earnings Set to Decline a Lot
Extreme Bearish Sentiment, But Positioning Less Clear
BTC Running Out of Sellers?
Any one of these topics are worthy of multiple hours of research and discussion, but I’ll do my best to summarize their impacts.
1. UK Gilt Crisis and Yield Curve Control

Source: TradingView. As of 9/29/22.
September 23rd was the second worst day for the British Pound in 10 years, behind only Brexit. What followed the next week was a Gilt market that teetered on the verge of collapse as UK pension funds were forced to sell Gilts to meet margin calls. In four trading days, from 9/22 to 9/27, the 30yr Gilt went from 3.6% to 5.1%. That’s what it looks like when the 6th largest economy in the world has a collapsing sovereign debt market.
This was a card carrying VaR shock, in the same vein as the US repo market blowout in September 2019. On 9/27 the BoE stepped in and announced “unlimited” purchases of 30yr Gilts to restore orderly market conditions. Technical adjustment. YCC. QE. Call it whatever you want. The BoE had to make the Money Printer Go Brrr to prevent the collapse of their debt and bail out their pension system. It’s hard to know what comes next. FX is not my wheelhouse and the situation is highly dynamic. But the preponderance of evidence leads me to have a lower GBP in the coming months as my base case. It is my base case this is not the last VaR shock we will see in the next six months, and maybe six weeks.

Source: TradingView. As of 9/29/22.
2. Nord Stream Pipeline Attack

On September 27th, the Nord Stream pipeline experienced significant damage near the Danish island of Bornholm. Later that day, the Swedish Prime Minister said the damage was likely the result of “a deliberate action.” Swedish seismologists from Lund University, said that “at least 100 kg of TNT has been used, but probably more to rupture the Nord Stream pipelines". This pipeline had already been of great focus, given that it accounted for ~35% of Europe’s natural gas imports from Russia, which are nearly half of all of Europe’s natural gas imports.
So the pipeline was really important. And then someone blew it up. The tin foil hat comes on really quick when you start looking into who might’ve blown it up. This Biden quote from February is making the rounds. Same with this quote from Victoria Nuland from January. A US warship was tracked near the site of the explosion a few weeks beforehand, while Russian navy support ships were also found immediately before the sabotage. I’m not sure if we’ll ever find out who was behind the attack. It obviously reeks of deliberate bad intentions. And it makes the EU’s natural gas crisis that much more acute (more to come below on that).
3. Ukraine Conflict Escalation
It’s hard to get particularly trustworthy information on the Ukraine conflict at the moment, given both sides’ propensity for propaganda. But by all accounts, Russia appears to have lost ground against Ukraine in September. In apparent response to that losing ground, Putin initiated a partial military mobilization, calling up 300,000 able-bodied Russian “reservists” into service for the Ukraine conflict. In further escalation, Russia conducted five days of “referendums” in four Russian-occupied regions of Ukraine. To the surprise of no one, the referendums came back in “overwhelming support” of Russia annexing these portions of Ukraine. This “referendum” gives Russia the ability to say that any Ukraine aggression is an attack on Russia itself, which apparently gives Russia the circumstances they need to justify the use of nuclear weapons against Ukraine. I don’t know how to handicap the likelihood of this occurring. I’ve seen experts say they still view nuclear weapons as unlikely, but it appears we’re moving into an explicit game of “Nuke Chicken” which is obviously the last thing you want to see. We have every indication to think the Ukraine conflict is set up for escalation in the coming weeks and months and the worst-case outcomes are terrifying. In total, the US has sent ~$17bn in military aid to Ukraine, so this is a straightforward proxy war the US is fighting with Russia via Ukraine. And it’s set to escalate.
4. EU & UK Natural Gas Crisis
As we have discussed here for the last several months, the EU and UK have a serious natural gas shortage problem, which was only further exacerbated by the Nord Stream sabotage. While European natural gas prices are 40% off their recent highs, they’re still 1,400% higher than two years ago, and severe demand destruction is underway. This does not bode well for economic activity.

Source: TradingView. As of 9/29/22.
Europe is scrambling to get this situation to a more tenable level as winter approaches. On September 8th, the UK announced an Energy Price Guarantee, which will cap energy prices to around £2,500/year per household on average for the next two years. The price cap is expected to cost the UK government £130-£170bn. On September 29th, Germany agreed to a $194bn energy cost relief package, with exact details to be firmed up next month.
While European nat gas storage levels are currently running high relative to past years, that only matters if you’re expecting the same flows this winter as you’ve had prior winters. Which isn’t at all the case because they’re fighting a war with each other via Ukraine.

As of 9/28/22.
Analyst estimates for 2023 European GDP have been coming down in the last few months as projections start to bake in demand destruction from sky high energy prices, but they are likely still meaningfully too high. The below chart helps visualize the magnitude of the problem Europe has currently.

Source: Bloomberg
When a much lower GDP projection is coupled with increased government spending to provide energy cost relief, you get a EURUSD chart that looks like this.

Source: TradingView. As of 9/30/22.
I struggle to see how this chart doesn’t head lower in the coming months. Europe is up against the ropes.
5. Yen Intervention
The BoJ had a rough go the last month, as they continue their egregiously easy monetary policy via YCC while the Fed is aggressively tightening. That setup produces a USDJPY chart that looks like this-

Source: TradingView. As of 9/30/22.
On September 22nd, as the USDJPY cross reached levels not seen since 1998, the BoJ stepped in for the first time in 24 years and sold $19.7bn USD for Yen to defend their currency. The BoJ holds ~$1tn of US Treasuries and has another $136bn in USD deposits. These figures matter because, should the BoJ exhaust its USD deposits, the fear is they will be forced to sell Treasuries to raise USD to defend the Yen. Which, given how dysfunctional Treasury markets already are, could set off a major VaR shock that could push global financial markets into full-blown turmoil. This situation is one of the single most significant risks as we head into October.
6. Yuan Intervention
China’s zero-Covid policy has ravaged their economy and cracks are emerging in several areas, most namely their property sector. China’s 20th Party Congress on October 16th should see Xi reconfirmed for a third term and is certainly an event to look out for this coming month. In the meantime, USDCNY has weakened aggressively back to the top of its 14-year range, which has the market wondering what, if any intervention may occur in the near-term.

Source: TradingView. As of 9/30/22.
China’s intentions are as opaque as they’ve always been, so it’s challenging to get a good feel for what’s going to happen here. Some variety of stimulus is likely to be in place in the coming months, which should further pressure USDCNY. China’s situation is not as dire as the EU, UK or Japan. They are not on the verge of a currency crisis. China has a mostly closed loop credit system and a number of levers they can pull to smooth over their economic woes. But it does look like it’s set to get worse before it gets better.
7. Dollar Wrecking Ball/DXY Milkshake
GBP. EUR. JPY. CNY. They’re all challenged. The first three could easily see a VaR shock event between now and year-end. The dollar is flexing its “our currency, your problem” status to a greater degree than we’ve seen in decades. This chart could easily test the dotcom highs between now and year-end.

Source: TradingView. As of 9/30/22.
8. Fed Tightening & US Inflation
The hot CPI print and the Fed’s steadfast commitment to aggressive tightening were two hallmarks of a historically eventful September. Going into the September 13th CPI print, Bitcoin and NASDAQ were up 13% and 6%, respectively. By the time we got around to Powell on the 21st, Bitcoin and NASDAQ had given back all those gains and then some. Powell delivered an unsurprising hawkish message and asset prices tumbled further still as the DXY wrecking ball continued its path of carnage.
The Fed Funds futures market is currently pricing in 3-2-1 hikes at the next 3 meetings, with a topping in the spring, and one rate cut by YE-23.

I think 75bps on November 2nd (there is no October meeting) is still up in the air and will depend primarily on the CPI print October 13th but will also depend on how shaky the rest of the world gets in October, and it could easily get a lot shakier.
Powell has clearly communicated his desire to cool off the labor market, and unfortunately since mid-July the trend is in the opposite direction. This gives Powell the green light to tighten more.

Source: TradingView. As of 9/30/22.
Part of Powell’s message at September’s FOMC presser was (in my view) essentially the abandonment of a “soft landing” scenario. His wording was nuanced, but he confirmed the Fed is more worried about slowing tightening too soon than not slowing tightening soon enough. Inflation and labor are both still running hot and the Fed is committed to smashing both. That means further tightening of financial conditions. To that end, the Fed made serious progress in September. TBD on “how tight is tight enough”.

The Fed appears willing to overshoot and if it gets ugly, then so be it. Last month I said,
“We’re living and dying with macro right now and unfortunately, I don’t think even the Merge is strong enough to decouple us in September. There’s a near-term path to thread the needle where the jobs number comes in light September 2nd and CPI comes in light September 13th and we get 50bps from the FOMC September 21st instead of 75. Perhaps that would be a supportive enough backdrop in macro for ETH to run into and after the Merge. But that would require a host of other macro risks to remain at bay and I’m not so sure it makes sense to have that as my base case.”
A month later and we have additional clarity on that setup. “Tightening until something breaks” is starting to get explicit nametags- JPY, GBP, EUR. And if the dollar wrecking ball doesn’t get the job done, there’s a good chance Putin will. It remains to be seen how much carnage will need to occur outside the United States before Powell feels compelled to do something. That will likely depend on how much contagion is felt in domestic financial markets, particularly the Treasury market. The MOVE Index is a pretty good gauge for that sort of thing, and it’s flashing a serious warning signal.

Source: TradingView. As of 9/30/22.
Another great way to gauge the likelihood of the Treasury market seizing is liquidity. And that looks terrible.

Source: Ollari Consulting. As of 9/29/22.
It’s scary how many of the ingredients are in place to have a global volatility event.
9. Public Company Earnings Set to Decline a Lot
This is a not-so-well-kept secret. I could show you ten different charts supporting the view that consensus profit estimates are too high and that earnings multiples will contract further. But here’s just a couple, presented without further comment.


Source: Ollari Consulting. As of 9/25/22.

As of 9/27/22.

Source: Zerohedge. As of 9/23/22.
What’s the takeaway? Even if we dodge a half dozen major macro landmines in the coming months, equities are likely still due for a protracted decline.
10. Extreme Bearish Sentiment, But Positioning Less Clear
At first glance, you can see heavily bearish sentiment and think we may be nearing a bottom.


Source: @charliebilello As of 9/29/22.

Source: TradingView. As of 9/20/22.
But when you look past sentiment to positioning, investors seem to be much more heavily invested in equities and much less cash than in past market bottoms.
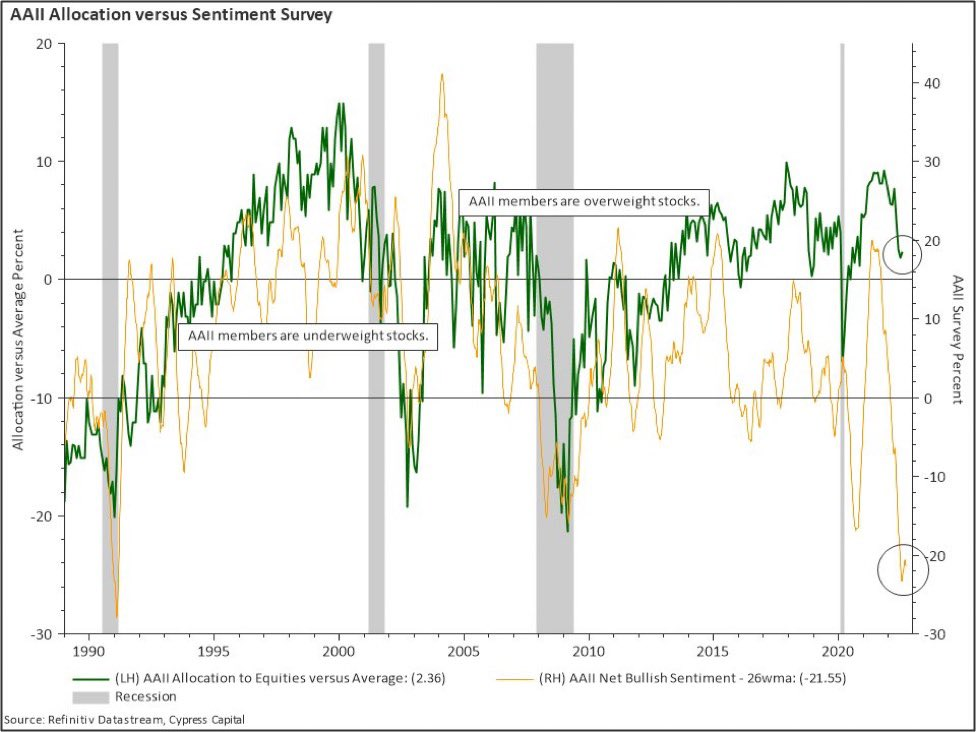
As of 9/23/22.

As of 9/22/22.
It’s hard to know with high conviction how much capitulatory selling might be left in equities. History would tell you this could get a lot worse.

As of 9/27/22.
When it comes to bonds, it’s been a historically painful year.

Source: @leadlagreport. As of 9/23/22.
11. BTC Running Out of Sellers?
Bitcoin’s price was challenged this month amongst a motley crew of macro boogeymen. Bitcoin performed significantly better in the last ten days of the month than you would have expected given the macro stress. It’s a bit too early to tell, but this divergence is certainly noteworthy-

Source: TradingView. As of 9/30/22.
Bitcoin has now tested this ~$18-$19.5 level five separate times, including multiday lingering in a tight price band around $19k.

Source: TradingView. As of 9/30/22.
Both SPX and NASDAQ closed September through their June 16th lows while Bitcoin wasn’t even able to test it’s June lows. This is peculiar price action and I’m not entirely sure what to make of it. Comparisons have been made to the 2018 price action around $6k, in advance of the November 2018 crash. And TBH I get it. We could be there.

Source: TradingView. As of 9/30/22.
The market we face today is different than 2018 for a myriad of reasons. One noteworthy reason is the general sentiment around $6k in 2018 was that “the support would hold.” I remember this clearly because I went on Pomp’s podcast in October 2018 and said price was going to go down 50% and people thought I was crazy. This time around the general expectation seems to be for lower prices. If my read on that is indeed correct, this may end up being a key distinction.
The recent price action sub-$19k has been peculiar. At moments when macro has been under significant stress, bid support will show up in Bitcoin and sellers will run out of gas. It happened repeatedly in September and I’m not sure what to make of it. Near as I can tell, there is significant capital willing to look through near-term macro stress and buy Bitcoin sub-$19k with a longer time horizon in mind. This demand has been meeting sputtering supply because let’s face it, if you’ve held Bitcoin all the way down already, why sell at $18.5?
Some market participants have posited that Bitcoin is stepping up as “sound money”. With a backdrop of major currencies collapsing, Bitcoin’s value proposition is being further appreciated by the market and thus is decoupling to the upside. There’s also a view that Bitcoin is decoupling here because it’s sniffing out that we’re nearing the end of tightening because something is about to break, and you want to own Bitcoin off the bottom there. There’s likely some truth to both those views, but my base case is if macro gets worse in October (and we’ve discussed many ways that could occur), BTC will not be able to hold that $18k level. It could be over in a hurry, but it’ll be a rocky road on the way there.
So What?
UK Gilt Crisis and Yield Curve Control. Nord Stream Pipeline Attack. Ukraine Conflict Escalation. EU & UK Natural Gas Crisis. Yen Intervention. Yuan Intervention. Dollar Wrecking Ball/DXY Milkshake. Fed Tightening & US Inflation. Public Company Earnings Set to Decline a Lot. Extreme Bearish Sentiment, But Positioning Less Clear. BTC Running Out of Sellers?
That’s a lot to consider. I’m not alone in seeing the difficulty of the current setup. The best investor in the world says now is the hardest environment to forecast he’s ever seen. I believe the near-term outlook is very dark but so are expectations. There are numerous potential VaR shock events lurking nearby. The market is priced for a lot of bad news, but there’s likely bad news on the horizon.
In any case, we are likely nearing an exceptionally attractive time and price level to increase exposure to crypto assets. If you have cash, you should get ready. If you don’t have cash, you should get some and get ready.
Market Update – Liquid Crypto Asset Investing
Guest Author: Ikigai Trader Asher Montague-Warr
| Symbol | Sep | Aug | July | Q3-22 | Q2-22 | Q1-22 | YTD | Q4-21 | Q3-21 | Q2-21 | Q1-21 | 2021 | 2020 |
|---|---|---|---|---|---|---|---|---|---|---|---|---|---|
| BTC | -3% | -14% | 18% | -2% | -57% | -2% | -58% | 6% | 25% | -41% | 103% | 60% | 303% |
| ETH | -15% | -8% | 58% | 24% | -67% | -11% | -64% | 23% | 32% | 19% | 160% | 399% | 469% |
| XRP | 46% | -14% | 15% | 45% | -59% | -2% | -42% | -10% | 31% | 23% | 161% | 278% | 14% |
| BCH* | 1% | -17% | 27% | 7% | -67% | -13% | -69% | -13% | -6% | -11% | 45% | 6% | 71% |
| EOS | -14% | 3% | 44% | 28% | -67% | -7% | -61% | -23% | -5% | -14% | 85% | 17% | 1% |
| BNB | 2% | -2% | 29% | 30% | -49% | -16% | -44% | 32% | 28% | 0% | 708% | 1269% | 172% |
| XTZ | -6% | -13% | 23% | 0% | -62% | -14% | -67% | -28% | 100% | -37% | 142% | 116% | 49% |
| XLM | 10% | -7% | 0% | 2% | -51% | -15% | -57% | -4% | -1% | -31% | 220% | 108% | 184% |
| LTC | -1% | -10% | 12% | 0% | -57% | -16% | -64% | -4% | 6% | -27% | 58% | 17% | 202% |
| TRX | -4% | -8% | 6% | -6% | -12% | -2% | -19% | -16% | 31% | -26% | 244% | 181% | 101% |
| Aggregate Mkt Cap | -4% | -10% | 22% | 7% | -58% | -5% | -57% | 13% | 33% | -23% | 146% | 186% | 301% |
| Aggregate DeFi* | 3% | -13% | 39% | 25% | -74% | -8% | -70% | 29% | 64% | -27% | 339% | 581% | 1177% |
| Aggr Alts Mkt Cap | -4% | -7% | 26% | 12% | -58% | -7% | -57% | 19% | 40% | 1% | 246% | 479% | 274% |
Source: CoinMarketCap. As of 9/30/22. BCH includes SV. Aggregate DeFi from Coingecko.
It’s been a big month for financial markets, and here we are on our 10th consecutive monthly bearish candle. September is also a notoriously rough month for Bitcoin historically and things in traditional markets are starting to break. Pivots in central bank policy may soon be on the horizon and seller exhaustion is now becoming more apparent. I believe there is light at the end of the tunnel.
The dollar may be starting to take a breather from its parabolic rise, but its currently halted just before a major technical high, which could mean it persists to make higher highs in the coming weeks. Should that occur, we will be watching closely for signs of distribution. A declining dollar should be a boon for crypto as sidelined capital waiting to reallocate begins dipping their toes back in.
Key Points
Dollar finally starting to cool off and showing signs of buyer exhaustion on technical indicators.
Bitcoins Seasonality hints that the worse may be behind us, for now
Puell Multiple continues to show strength and a possible reversal signature
HODL waves which have yet to be broken are showing that Bitcoin is in a “fire sale”
Funding yet to show us a really good indication of a bottom yet
QQQ broke the 200 weekly moving average which has only happened once before
Liquidity at the lows still remains an attractive target
Bitcoin still yet to make a ST or Spring if we are in an Wykoff-like pattern
Stablecoin supply at all time high, meaning there’s a ton of capital on the sidelines
Net unrealized profit and loss show that investors are in the capitulation phase
Interesting on chain metrics show that short term holders or speculators are capitulating and leaving the market while long term more experienced are accumulating

Source: TradingView. As of 9/30/22.
Shown above, BTC’s worse average month is September, and its best month is November. BTC extended its streak to six consecutive years of negative September returns.

Source: LookIntoBitcoin. As of 9/30/22.
The Puell Multiple (above) has shown resilience. Despite price falling this month the indicator has not fallen as sharply, exhibiting divergence. This may indicate that weak miners have capitulated, and stronger miners aren’t forced sellers. This setup may alleviate some of the downward price pressure from miner outflows and allow Bitcoin price to find a cyclical bottom.

Source: LookIntoBitcoin. As of 9/30/22.
Now here’s a happy looking indicator! Well, at least it cheered me up. This indicator is a long-term valuation tool designed to help detect market cycles with the upper bands showing overbought and the lower bands showing oversold. Price has now traversed the rainbow and currently sits firmly in the “fire sale” lower band. Historically these periods have been excellent times for savvy investors to accumulate more Bitcoins.

Source: TradingView. As of 9/30/22.
Perp Funding Rates have been a hard read lately. One would expect a much more extreme negative funding reading on BTC at these low price levels. And while funding is indeed negative and shorts are paying longs, it’s not nearly to the extent of previous bottoms. This may point towards further downside in price to push the maximum number of participants short in an almost “bearish euphoria” type of event. We’ve seen that sort of thing before and could see it again. Strongly negative funding rates would give me a lot more confidence to enter a counter position in such a circumstance, but I’m not sure if we’ll get it. That market structure may have just changed. In either case, further patience seems required for the ultimate entry.

Source: TradingView. As of 9/30/22.
QQQ (above) has broken its 200 weekly MA - an ominous sign as the last time a break occurred was 08 right as everything fell off a cliff. There is some chance though it’s a false breakdown since we are seeing some bullish divergences. Understanding the drivers for traditional markets will be crucial over the next month. With BTC so closely correlated to traditional, if QQQ’s were to break down here in a big way, then BTC is highly likely to follow. One positive and noteworthy recent feature is that BTC’s correlation to traditional has weakened in the past month and specifically the past 10 days.

Source: Hyblock Capital. As of 9/30/22.
The indicator above shows areas of estimated liquidity based off open interest. While this indicator is not a discreet measurement but rather an estimate, it does paint a picture of trader behavior. We can see we are building up more bright areas below us, which indicates an attractive area where very large institutions may want to enter a long position into the highest selling liquidity possible. It is highly probable that if we did enter those lower liquidity zones at ~$18k, then price would likely snap back pretty quickly, potentially creating a spring for the market to bottom. Time will tell.
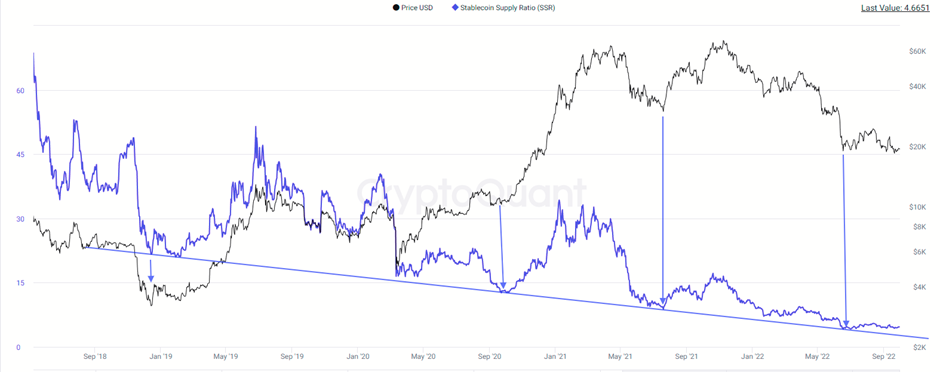
Source: CryptoQuant. As of 9/30/22.
The indicator above shows us Stablecoin Supply. The lower the level, the more capital there is to deploy. You may notice that it’s been on a decline over the years. This is due to the large increase in stablecoin market cap. Right now, stablecoin supply is at an all-time high. While there is a sort of hindsight bias present in this analysis, I still find it useful. We are seeing a cyclical bottom signature and there’s a ton of capital waiting to deploy. When it does, buckle up!

Source: CryptoQuant. As of 9/30/22.
Net Realized Profit and Loss shows us the difference between market cap and realized cap divided by market cap. It assumes the latest coin movement on chain is a result of a purchase of bitcoin and calculates a ratio of investors that are in profit. We are currently in a period of capitulation with a large portion of investors in a serious loss. This is synonymous with previous bottoms and grants confluence to the idea that we are close to a bottom.

Source: CryptoQuant. As of 9/30/22.
HODL waves (above) shows us the behaviors of different types of holders. In red we have short term holders that recently bought BTC. They could be described as speculators or perhaps investors that are relatively new to BTC. The green and purple lines represent more seasoned investors that have held BTC for years. The behavior of the two is striking. We see the speculators and newbies capitulating and their BTC holdings declining, whereas the more seasoned investors are actually accumulating more. Perhaps it’s not their first rodeo or they simply have much stronger belief in the technology and are in it for the long term.
To summarize, I feel optimistic about the market right now despite it being a brutal month for crypto. The need for decentralized solutions such as Bitcoin in the light of currencies collapsing becomes even more apparent. My faith in Bitcoin long term remains sturdy and by the looks of on-chain activity, I do not stand alone. The light may well be at the end of the tunnel soon, but I don’t want to underestimate the bears - the gravity weighing on BTC from the macro backdrop is heavy. While numerous technical indicators are showing really positive signs that we are close to a macro bottom, we still have that liquidity that institutional investors will be salivating over in order to get their bids filled. And the QQQ is of some concern too - if it does make a repeat of 2008 then that could be the catalyst for BTC to also sweep its current lows and make a break for that liquidity spring which may well be the bottom we have all been waiting for. I hope this has helped and I look forward to more celebratory messages in the Monthly Updates to come.
Closing Remarks
This Monthly Update was about as macro as it gets because this market is about as macro driven as it can be at the moment. The risks are multifaceted, large and knocking on the door. It’s adult swim out there for sure. Most market participants are anticipating bad things to happen, but that doesn’t mean it’s smart to be contrarian just for contrarian’s sake. Bitcoin down 3% in September with NASDAQ down 11% is noteworthy outperformance, but it’s tough to have continued decoupling as your base case moving into October. If we thread the needle on macro and manage to sidestep a bunch of different landmines and somehow manage to deliver on some good macro news, Bitcoin could easily lead equities to the upside. It’s just tough to have that as your near-term base case.
But that’s just short-term price action and I’m highly convicted that this too shall pass. As investors you should be skating to where the puck is going which means you must look through the near-term macro stress to imagine what the world looks like on the other side. What does crypto look like with a treaty in Ukraine? What does crypto look like with Fed tightening on pause? What does crypto look like with the Fed cutting rates? That world could easily be much closer to now than it might feel at the moment. Now is an outstanding time to be DCA-ing into crypto exposure, and if you can find an active manager that you trust, that’s probably even better. The winds of change are constantly blowing in crypto and no time harder than bear markets. Bear markets are where narratives get tested under a microscope and many crumble under the weight of dispassionate examination. The willingness to ignore a lack of compelling value accrual mechanisms suddenly goes away when everything is down 70%+ from the highs. The market actually starts asking hard questions. This is a good and necessary thing. Bear markets are for change. For innovation. For advancement. For keeping what works and cutting what doesn’t.
From that perspective, you’d almost prefer this bear market to drag on longer. So we can separate even more wheat from the chaff. A couple more quarters or maybe even all of 2023. It’s not like the space is going to run out of money to fund startups. That’s a laughable prospect at this point. This ecosystem is buzzing with activity. Hundreds of millions of dollars of permanent capital is being injected into crypto projects every month from the cashed-up VC community. Many dozens of deals from pre-seed to Series C are funded each month and we’re years away from that dry powder being extinguished, with fresh capital being raised every day.
Make no mistake, the space isn’t going anywhere. If the British Pound blows up. If Putin drops a nuke. If QT implodes the Treasury market. Crypto isn’t going anywhere and it will continue growing and innovating. By the time we get through this macro stress to bluer skies, I’m hopeful we’ll have a fresh cycle’s worth of new ideas to bring to the world.
“One who smiles rather than rages is always the stronger.”
– Japanese Proverb

Travis Kling
Founder & Chief Investment Officer
Ikigai Asset Management
P.S.
Included below is an incomplete list of memorable tweets from the last month. Twitter is not investment advice and my views could easily be wrong. That being said, like it or not, Twitter matters for crypto. I have no interest in being a talking head for a living and babbling about on Twitter is a long way away from being a good steward of investor capital. However, this is a community with open-source software in its DNA, and participants want to crowd-source the truth. We are shepherds of this technology. Answers to fundamental questions about this asset class are not currently clear, so having a public platform to share your views with the community is important. After all, you’re helping shape the future :)
1. Ikigai Asset Management is the trade name for a collection of advisory and consulting businesses operated by Travis Kling, Anthony Emtman, and their team.
The information contained or attached herein is not intended to provide, and should not be relied upon for, accounting, legal or tax advice or investment recommendations. This presentation may contain forward-looking statements that are within the meaning of Section 27A of the Securities Act of 1933 and Section 21E of the Securities Exchange Act of 1934. These forward-looking statements are based on management’s beliefs, as well as assumptions made by, and information currently available to, management. Although management believes that the expectations reflected in these forward-looking statements are reasonable, it can give no assurance that these expectations will prove to be correct. This email is for informational purposes only and does not constitute an offer to sell, or the solicitation of an offer to buy, any security, product, service of Ikigai as well as any Ikigai fund, whether an existing or contemplated fund, for which an offer can be made only by such fund’s Confidential Private Placement Memorandum and in compliance with applicable law. Past performance is not indicative nor a guarantee of future returns. Please consult your own independent advisors. All information is intended only for the named recipient(s) above and is covered by the Electronic Communications Privacy Act 18 U.S.C. Section 2510-2521. This email is confidential and may contain information that is privileged or exempt from disclosure under applicable law. If you have received this message in error please immediately notify the sender by return email and delete this email message from your computer. Copyright 2021 Ikigai Asset Management, LLC. All Rights Reserved.
NOT INVESTMENT ADVICE; FOR INFORMATION ONLY
PAST PERFORMANCE IS NOT A GUARANTEE OF FUTURE RESULTS
