
March 2024 - Monthly Market Update
/Monthly Update || March 2024
“Economies and markets cycle up and down. Whichever direction they’re going at the moment, most people come to believe that they’ll go that way forever. This thinking is a source of great danger since it poisons the markets, sends valuations to extremes, and ignites bubbles and panics that most investors find hard to resist.”
Opening Remarks
Greetings from Ikigai Asset Management¹ headquarters. We welcome the opportunity to bring to you our sixty-sixth Monthly Update and hope these are helpful in better understanding some of what we’re doing and what we’re seeing. We have the privilege of deploying capital on behalf of our investors into a new technology and asset class that has tremendous potential to make the world a better place and create trillions of dollars of value in the process.
We believe we are obligated to be shepherds of this technology – to do our part to push crypto towards fulfilling its potential. We strive to be an objective, reasonable, well-intentioned voice of truth amongst a chorus of biased, fallacious, pernicious opportunists. It’s an honor that we take seriously.
To that end, the crypto market teleported forward in February with BTC and ETH having two of their best months ever - up 44% and 46%, respectively. Bitcoin’s price increased $18.6k in February – the largest nominal monthly increase ever. Needless to say – big, big month. Up until this point, there was plenty of disagreement about where exactly we were in the cycle, and what expectations were prior to the halving on April 19th. We now know exactly where we are – 10% below Bitcoin ATHs.
The drivers of this price action were dead simple. The BTC ETFs experienced $6 billion of net inflows in February, and that is just a way bigger number than anyone was expecting. There are so many eyeballs on the ETF inflows, that when $4/5/600mm+ a day started showing up to buy, sellers dried up and price rocketed higher.
The ETF flows got us here and the ETF flows will take us wherever we’re going from here in the near-term, a topic I dive into more later.
This last month has been a bit surreal. I say this often, but crypto is a WILD thing to do for a living. Running an investment fund in crypto is a WILD job. And it’s felt like that this past month in a good way, after quite a long period of time where doing this job was WILD in a rough way. It feels good, and I know nearly everyone else in crypto is feeling the exact same way. That’s noteworthy in itself.
If you’ve been reading these, you know I have concerns about the stability of this asset class and this technology. You know I worry about the foundation this whole thing is built on. That’s still the case, even though I think prices are about to go gong show (I explained this to you at length last month and then prices just went gong show). So that’s the setup we are facing. Blow another bubble – bigger than ever. Collapse another bubble – bigger than ever.
Maybe the real “making the world a better place” is the friends you met along the way?
Invest
Ikigai is currently fielding interest from new investors globally. We are open to international investors and qualified accredited U.S. investors (including self-directed IRAs).
We accept new investors on the 1st and 15th of every month.
Contact us to see if you qualify.
February Highlights
Spot BTC ETFs See Massive $6 billion in Net Inflows, Driving BTC +44%
Coinbase App Store Ranking Climbs from #430 to #150 in Four Days
Uniswap Proposes Large-Scale Upgrade to Governance Incentives, Introduces Fees as Rewards, Price Spikes 70%
Gemini Earn Reaches Settlement in Genesis Bankruptcy to Return 97% of Assets In-Kind
NYAG Expands Civil Fraud Case Against DCG, Triples Estimate of Fraud Size to >$3bn
Merrill and Wells Fargo Begin Offering BTC ETF Access to Some Wealth Management Clients
Franklin Templeton Files for Spot ETH ETF
Several ETF Providers Refile Spot ETH ETF Applications, Include Staking Capabilities
MSTR Buys $155mm of BTC at $51,813
Ethereum Restaking Protocol EigenLayer Raises $100mm Led by A16Z
Solana Blockchain Experiences 5-Hour Downtime
Circle Discontinues USDC on Tron, Sparking Rumors of Trouble with Justin Sun
Nigeria Blocks Access to Binance, Coinbase and Kraken
Crypto Freedom Alliance of Texas and Legit Exchange Sue SEC for Lack of Clarity
RobinHood Partners with MetaMask, Allowing Trading and Transfers Between Products
RobinHood Partners with L-2 Arbitrum, Allowing RH Wallet Users Access to Swaps
Genesis Estates Receives Approval to Sell >$1.5bn of GBTC
Fidelity Canada Recommending 1-3% BTC Allocation in All Portfolios
Changpeng Zhao Sentencing Date Postponed Until April 30th
SEC Adopts Rule for Stricter Oversight Over Dealers, Including Crypto and DeFi
Farcaster Launches New Frames Feature, Sees Spike to 57k MAU
Binance Delists Privacy Token Monero
Reddit States in S-1 They Have Invested Excess Cash into BTC and ETH
DOJ Charges Three People in SIM-Swapping Case of Stealing $400mm of Crypto from FTX
FTX Debtors Sullivan & Cromwell Rumored to Be Appointed as Binance Monitor
Su Zhu and Kyle Davies’ OPNX Ceases Operations and Shuts Down
VanEck Launches NFT Marketplace and Digital Assets Platform SegMint
Starknet Runs Unethical Airdrop/Unlock Scheme, Market Revolts, Starknet Changes Airdrop/Unlock Mechanism
FTX Estate to Sell 8% Position in Anthropic AI
IRS Hires Former Binance US Exec to Beef Up Crypto Expertise
| Asset Class | Feb | Jan | YTD | Q4-23 | Q3-23 | Q2-23 | Q1-23 | 2023 | 2022 | 2021 | Instrument |
|---|---|---|---|---|---|---|---|---|---|---|---|
| Bitcoin | 44% | 1% | 45% | 57% | -12% | 7% | 72% | 155% | -64% | 60% | BTC |
| NASDAQ | 5% | 2% | 7% | 14% | -3% | 15% | 21% | 54% | -33% | 27% | QQQ |
| S&P 500 | 5% | 2% | 7% | 11% | -4% | 8% | 7% | 24% | -19% | 27% | SPX |
| Total World Equities | 4% | 0% | 4% | 10% | -4% | 5% | 7% | 19% | -20% | 16% | VT |
| Emerging Market Equity | 4% | -5% | -1% | 6% | -4% | 0% | 4% | 6% | -22% | -5% | EEM |
| Gold | 0% | -1% | -1% | 12% | -4% | -3% | 8% | 13% | -1% | -4% | GLD |
| High Yield | 0% | 0% | 0% | 5% | -2% | -1% | 3% | 5% | -15% | 0% | HYG |
| Emerging Market Debt | 0% | -1% | -1% | 8% | -5% | 0% | 2% | 5% | -22% | -6% | EMB |
| Bank Debt | 1% | -1% | 0% | 1% | 0% | 1% | 1% | 3% | -7% | -1% | BKLN |
| Industrial Materials | -2% | -3% | -5% | -5% | 7% | -11% | 4% | -6% | -13% | 29% | DBB |
| USD | 1% | 2% | 3% | -5% | 3% | 0% | 0% | -2% | 8% | 6% | DXY |
| Volatility Index | -7% | 15% | 8% | -29% | 29% | -27% | -14% | -43% | 26% | -24% | VIX |
| Oil | 3% | 6% | 10% | -18% | 27% | -4% | -5% | -5% | 29% | 65% | USO |
Source: TradingView. As of 2/29/24.
Financial Nihilism: The Zeitgeist of Young America

So, apparently last month’s main section “A Lack of Pretense That Any of This Shit Does Anything or Will Ever Do Anything”…was quite a doozy. I’ve been writing these for a long time so I think I have a decent sense of when I write something above or below the average of all the monthlies I’ve written previously. And I knew the one last month was a good one when I wrote it. But even I underestimated how much “A Lack of Pretense…” was going to strike a chord with folks. Because when I turned the main section into a tweet thread, it went properly viral – 2k+ bookmarks, 500k+ views. Big numbers for content that meaty. But it wasn’t just the raw numbers of the response, it was the qualitative characteristics of the response. The thesis REALLY resonated with people. I received many dozens of responses through numerous avenues (Twitter comments, reposts, DMs, Telegrams, text, email, podcasts). By my estimate:
80% of the response was strong agreement (with varying levels of begrudgingness);
10% was “you don’t know what you’re talking about”; and
10% was some form of pushback/disagreement (with varying levels of thoughtfulness).
I did two podcasts in the weeks that followed unpacking the thesis further - you can listen/watch here and here.
Probably the topic within the thesis that garnered the most discussion was the concept of “financial nihilism” – the idea that cost of living is strangling most Americans; that upward mobility opportunity is out of reach for increasingly more people; that the American Dream is mostly a thing of the past; and that median home prices divided by median income is at a completely untenable level. You can click this link and spend 10 mins scrolling through the mentions of “financial nihilism” on Twitter over the last few weeks. It would be 10 minutes well spent.
Given how much discussion this concept sparked and how deeply it resonated with folks, this month we will unpack Financial Nihilism in more detail. To begin, it is not my term. Credit belongs to Demetri Kofinas, the host of the Hidden Forces podcast. He first introduced the concept at least 2 ½ years ago. Financial Nihilism goes hand in hand with Populism - a political approach that strives to appeal to ordinary people who feel that their concerns are disregarded by established elite groups. Populism is a topic I’ve discussed numerous times here in the past, perhaps most pointedly in my February 2021 monthly about Gamestop. The underlying drivers of Financial Nihilism and Populism are the same – this system is not working for me, so I want to try something very different (e.g., buy SHIB or vote for Trump).
How would you go about characterizing the drivers of Financial Nihilism? As previously mentioned, the chart of median home prices to median household income is the single most emblematic symbol of Financial Nihilism in my opinion.
Shown below with a couple annotations –

Source: longtermtrends.net. As of October 2023.
You can see Boomers (and GenX) bought all the houses at about 4.5x annual income. Then subprime lending fueled the housing bubble and the bubble collapsed. Not long thereafter, Millennials entered the workforce and got to the point where they could start buying houses at ~5.5x annual income. Then Covid happened, the Fed printed $6 trillion, and now houses are 7.5x annual income, much higher than even the peak of the housing bubble. Simply out of reach for many millions of Americans under 40. The numbers just don’t add up.
We can drill down into this real estate situation further. Shown below is the share of total real estate value by generation in the US-

Source: FRED. As of Q3-23.
From 1989 to 2023, the total value of US real estate held by households went from $7tn to $45tn, nearly a 7x increase. In 2020, when the youngest Millennial turned 25, Millennials held 13% of total real estate value. In 2005, when the youngest GenX turned 25, their share of housing wealth was 17%. And in 1989, when the youngest Boomer turned 25, they already had 33% of total real estate value. Kind of a raw deal for the current generation of young folks, right?
Let’s keep going though. Here’s the distribution of household wealth by generation. Similar type of chart as above, but looking at total net worth vs just real estate –

Source: FRED. As of Q3-23.
From 1989 to 2023, total US household wealth increased from $20tn to $143tn, a 7x increase. Drilling down into these numbers, the rise of Financial Nihilism among young people is hardly surprising. In 2020, the youngest Millennial turned 25, and Millennials had a paltry 5% of total household wealth. Compare that to GenX – in 2005 the youngest Gen X’er turned 25, and their generation had already amassed 8% of all household wealth. Then compare that further to Baby Boomers – in 1989 the youngest Boomer turned 25 and by that point the Boomer generation had gathered 20% of total household wealth. Maybe they got that from making coffee at home and skipping the guac at Chipotle!
Looking at these statistics from wealth percentile instead of generation is equally as discouraging-

Source: FRED. As of Q3-23.
Again, total wealth over this time increased 7x from $20tn to $143tn. The top 10%, top 1% and top 0.1% all saw big increases in their relative share over this timeframe, while the bottom 50% actually lost a little ground. Literally watching the rich get richer while the American Dream of upward mobility slips out of reach for the majority. Tough.
Looking at the same analysis for real estate value yields a slightly different looking chart but with the same results –

Source: FRED. As of Q3-23.
The whole pie grows $38tn over this time, and the rich get richer while the Bottom 50% actually lose ground.
I’ll give you one last chart to prove my point before we move on. Below is the ratio of Median Household Income to the S&P 500. Think of it as, “how many shares of the SPX can I buy with a year’s worth of median income?”

Source: FRED. As of Q3-23.
Again, it paints a tough picture. Back in the early 60’s you could get 94 shares of the SPX with the median household income. That peaked in the crash of 1982 at 219 shares and then structurally collapsed. The stock market is getting less and less affordable for the average American.
That’s the setup. The Boomers have all the money. The rich have been getting richer while the poor are getting poorer. The American Dream of upward mobility has been slipping out of reach for increasingly more people. Why do you think Oliver Anthony exploded out of nowhere into such popularity? That is Financial Nihilism. So if you’re like the large majority of Americans and you’re on the wrong end of this, what do you do about it?
You take bigger risks. You feel driven to take bigger risks to try and leapfrog from your current financial position (mostly paycheck to paycheck; buying a home feels nearly impossible; saddled with student loans; salary increases not keeping up expense increases) to something more tenable. More comfortable. More baller.
So you gamble. You. F**king. Gamble. You look anywhere, for anything, that can give you a 5:1, 10:1, 50:1 type of payout. Naturally, you look to literal gambling, which is growing at a breakneck pace-

Within gambling broadly, you look to sports gambling which is now available on your phone while you’re sitting on the couch. Incredible growth rate –

ource: American Gaming Association.
By the way, this year’s Super Bowl? Smashed betting records-

Going even further towards Financial Nihilism, you could look at the rise in the popularity of parlay bets, which include winning multiples of your original bet if you correctly win all bets made in a multi-bet series.
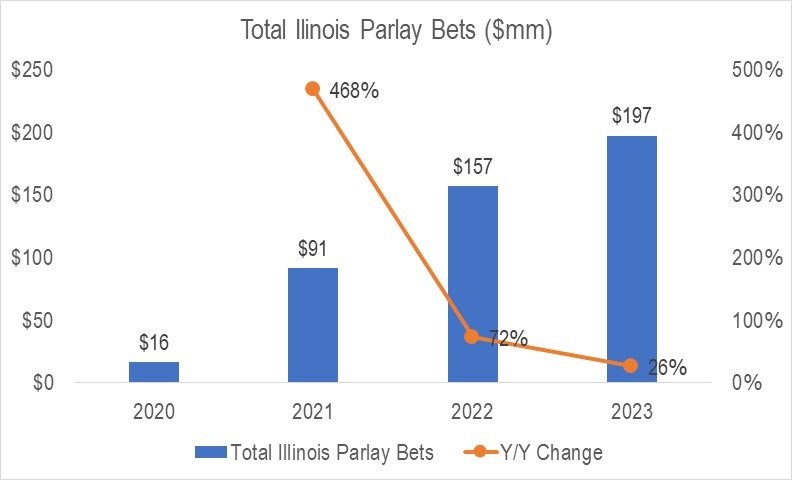
Source: Illinois Gaming Board.
The state of Illinois was the only source I could find that had parlay-specific data going back multiple years. But that insane growth shown in the chart above is indicative of the growth in popularity of parlays broadly. And as a reminder, these are bets where the “house odds” are better than regular bets, even while the potential payoff is much higher. When the numbers don’t add up, might as well swing for the fences even when you’re more likely to strike out.


You know what parlays are kinda like? 0DTE options - options that expire the same day they are bought. Like parlays, 0DTE options offer higher probabilities of loss while offering potentially multiples of upside. Oh yeah, and either way the outcome occurs the same DAY you place the bet…err umm, same day you “make the investment”.
You know what 0DTE options popularity has been doing lately?

0DTE popularity has doubled since Covid. That’s a growth rate that looks familiar, right? Between 2016 and 2023, 0DTE trading increased from 5% of total SPX options volume to 43%.
The evidence for the rise of Financial Nihilism is all around us. Think about the cultural movement that was WallStreetBets, DeepFuckingValue, Gamestop, AMC, Bed, Bath & Beyond, Blockbuster. They cranked out a Seth Rogen movie in like EIGHTEEN MONTHS. That’s how top of mind Financial Nihilism is.
One more thing to add, and then I’ll bring this all back to crypto. Those individuals choosing to act out Financial Nihilism are doing so in direct response to, and in imitation of, the monetary and fiscal policies of the Fed and the US government. Those monetary and fiscal policies have been a major driver of wealth inequality both through generations and wealth percentiles. The US government has been egregiously irresponsible. Makes a poker player look like Dave Ramsey. I’ve talked about this for years here, but I’ll give you a couple reminders-

Source: longtermtrends.net.


US been wilin’ with the dollar lately. Bitcoiners were on to this before anyone else. When the government is acting crazy, you might need to do something crazy in response – a 5-leg parlay, 0DTE TSLA calls, or long magic internet money - because the money printer has been, and will continue to, go brrrr. This causes asset price distortions of all sorts. This causes risk-taking distortions of all sorts. You’d be foolish to think otherwise.
Which brings us all the way back to crypto - the Roman Colosseum for asset price and risk-taking distortions. We will do some stuff that makes 0DTE Tesla calls looks like gold sitting in Fort Knox. Our Memecoins do numbers that make the Memestocks look like the DXY-

Importantly, crypto is a populist movement. A countercultural movement. A YOUNG PERSON’s movement. Boomers don’t get it. It’s “our” thing. It’s the one thing we can actually beat Boomers at (so far). Regardless of whether Boomers show up to crypto now, in the coming years, or not at all, eventually they will leave this world behind for that big country club in the sky. And their assets, which are tremendous –

…will pass down to the next generation. What is going to come of those assets? More gambling. More 0DTE options. More crypto. Be honest with yourself. Run this whole thing out 20-30 years. What do you honestly think it’s going to look like? Like if Dave Portnoy and Ready Player One had a baby.
So What?
I wrote this month’s main section about Financial Nihilism because I believe the concept is such a key driver of crypto price action, and because it struck such a chord with folks last month. I hope you understand it now better than you did a few minutes ago. I feel like I understand it better now than I did when I started writing this. I’ve come away with the view that Financial Nihilism is strong and getting stronger. It’s a feeling that’s pervasive in American society (and abroad). Financial Nihilism is a major driver of crypto price action, you can argue it’s getting even stronger, and it will be with us in a major way this coming cycle.
You can wish that weren’t the case. You can wish the crypto market would be more sound-minded. More sober. More focused on providing solutions to real problems. More rooted in reasonable valuation methodologies. Less bubble-ish. But I believe those wishes will be left ungranted. At least this cycle. There’s good reason to think this market is going to shitcoin harder than ever this cycle. That there will be an even greater “Lack of Pretense That Any of This Shit Does Anything or Will Ever Do Anything”. That we will blow an even bigger bubble and subsequently collapse an even bigger bubble. The drivers of Financial Nihilism and incentive structures that come along with it are simply too overwhelming. Act accordingly.
Market Update – Liquid Crypto Asset Investing
| Symbol | Feb | Jan | YTD | Q4-23 | Q3-23 | Q2-23 | Q1-23 | 2023 | 2022 | 2021 |
|---|---|---|---|---|---|---|---|---|---|---|
| BTC | 44% | 1% | 45% | 57% | -12% | 7% | 72% | 155% | -64% | 60% |
| ETH | 46% | 0% | 46% | 37% | -14% | 6% | 52% | 91% | -67% | 399% |
| XRP | 17% | -18% | -5% | 19% | 9% | -12% | 58% | 81% | -59% | 278% |
| BCH* | 25% | -15% | 7% | 33% | -24% | 117% | 16% | 157% | -75% | 6% |
| EOS | 25% | -18% | 2% | 45% | -22% | -37% | 38% | -2% | -72% | 17% |
| BNB | 33% | -4% | 28% | 45% | -10% | -24% | 29% | 27% | -52% | 1269% |
| XTZ | 27% | -3% | 23% | 47% | -15% | -28% | 56% | 39% | -84% | 116% |
| XLM | 11% | -15% | -6% | 15% | 1% | 1% | 55% | 81% | -73% | 108% |
| LTC | 20% | -8% | 10% | 10% | -39% | 21% | 28% | 4% | -52% | 17% |
| TRX | 25% | 4% | 30% | 21% | 16% | 27% | 10% | 98% | -28% | 181% |
| Aggregate Mkt Cap | 41% | -3% | 36% | 51% | -6% | 1% | 49% | 119% | -64% | 186% |
| Aggregate DeFi* | 34% | -6% | 26% | 72% | -5% | -5% | 50% | 132% | -77% | 581% |
| Aggr Alts Mkt Cap | 35% | -5% | 29% | 53% | -2% | -5% | 33% | 90% | -64% | 479% |
Source: CoinMarketCap and CoinGecko. As of 2/29/24. BCH includes SV.
So, uhh, crypto ripped in February. BTC was +44% on the month, strongest monthly performance since December 2020 and largest nominal monthly increase ever. ETH was +46% on the month. Very few Alts kept up with BTC and ETH’s performance in February, but many were still up strongly.
It’s not always the case that when Bitcoin price goes up or down a lot, there’s an easy answer to the question “why”? But in this case, the reason why BTC price went up so much in February is crystal clear. BTC ETF inflows have massively outperformed all experts’ predictions. We are less than two months into the ETFs trading and they have bought a stunning 146,522 Bitcoin - $15.9bn of total inflows, net of $8.4bn GBTC outflows, totaling $7.5bn of net inflows. No expert was predicting these numbers over this timeframe. A quarter of this amount would have been considered a smashing success. Thus, BTC is currently within spitting distance of ATH.
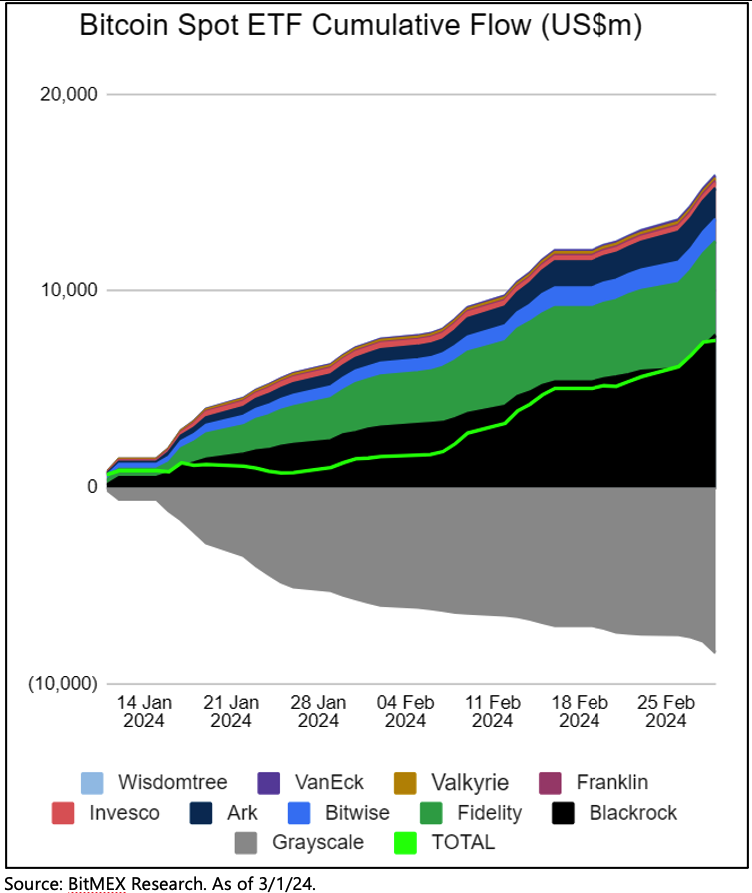
Source: BitMEX Research. As of 3/1/24.
Last month I said, “it’s also easy to see how once GBTC outflows abate, price is likely heading higher.” February was exactly that. In size. And price responded accordingly.
Below is a collection of predictions from domain experts for first year BTC ETF flows.

Source: Fundstrat. As of 1/10/24.
So, $28bn average expectation for first year. We’re currently at $7.5bn (and that’s NET of $8.4bn out of GBTC), which is way ahead of schedule. There are literally many trillions of dollars of capital that still cannot access the spot BTC ETFs. This point is highlighted below –

It’s worth noting that pretty much anyone that knows Bitcoin trading would have said “if we get $28bn in the first year, we’re def going to ATH and probably well beyond”. So that $28bn average was not some lukewarm expectation. Expectations were high. But 7 weeks in, expectations have been greatly exceeded. Number go up.
With Bitcoin currently sitting at ~$62.5k, only ~10% away from ATH, there’s a reasonably high likelihood BTC breaks ATH in the next month. Hell, it could happen next week. This week saw >$2bn of net ETF inflows. If we get that same amount next week, it wouldn’t surprise me at all if we were at new ATH a week from today.
There are near-term risks that could put at least a temporary pause on this parabolic advance we experienced in February. Gemini is selling >$1.5bn of GBTC, but that will likely have limited market impact because they are returning the BTC coming out of GBTC in-kind to creditors. The US government just moved $922mm BTC from the seized Bitfinex hackers. This may be coming to market soon.
Additionally, from a purely TA cycle analysis, the first attempt to break prior ATH monthly close has always failed-

On the other hand, is a particularly compellingly bullish chart, again from @pladizow. This shows:
1) each halving in dotted yellow;
2) each month where the monthly RSI breaks above 70 in green;
3) each cyclical price peak in dotted red; and
4) the number of days from when monthly RSI breaks above 70 to the cyclical peak.

It’s a compelling chart. The punchline is, since BTC is an incredibly momentum-driven asset, you actually want to BUY the overbought RSI, not sell. An overbought monthly RSI is actually the blastoff signal. And you have about 14 months of party time from that point until it’s over. This would tell you to buy now and buy more on any dips that may occur in the near-term.
Last one on BTC, again from @pladizow. This basically proves the point again, this time with Fib retracements from ATH’s to cyclical lows, back to new ATHs. Once price breaks through the 0.786 Fib retracement, it’s showtime. Exciting stuff.

Overall, we can argue about exact timing, but it’s looking like this market has now shifted fully into “go mode”. The halving is scheduled for 4/19/24 and there is a very real chance we hit new ATHs before then, which has never happened before with BTC.
Market participants are beginning to refer to this as a “left translated cycle”, meaning it seems like the typical four-year cycle is being pulled forward by 6+ months. It’s happening for good reason – massive BTC ETF inflows, stocks ripping to new ATHs, Fed getting ready to start easing. This feeling that the cycle is getting pulled forward is also a function of mimetic reflexivity, which we discussed here last month. By “mimetic” I mean imitation, mimicry. By “reflexivity” I mean, higher prices beget higher prices and lower prices beget lower prices. The strength of “3 up 1 down” is acting like a magnet for attention and capital. Mimetic reflexivity is a massively strong driver of crypto markets, and its presence can certainly be felt in the current setup.
Below is a chart I’ve shown before. Aggregate Market Cap, excluding BTC, ETH, USDT and USDC. Think of it as an approximation for Alt Market Cap.

Source: TradingView. As of 2/29/24.
While Alts lagged BTC and ETH in February, they still had a very strong month, up ~35%. Importantly, you convincingly broke through a significant resistance zone (yellow), after failing an initial attempt and consolidating underneath that resistance for about a month. I believe this chart now has room to run. There’s a bit of resistance at the current level, but the first major resistance is +50% from here, and then the major resistance around prior ATH, which is about a double from here.
Next I will present to you a new chart. The chart is enormously busy, but bear with me, it’s worth your time. And I will likely be referencing it regularly for the next 18 months, so you might as will get used to it now.
Below is the same Alt Market Cap chart shown above, but divided by the market cap of BTC and ETH. So think of it as “Adjusted Alt Dominance”. What % is Alt Market Cap relative to BTC and ETH’s market caps? When it’s going up Alt Market Caps are gaining ground on BTC and ETH. When it’s going down, BTC and ETH market caps are gaining ground on Alts. The second panel below is simply BTC price.

Source: TradingView. As of 2/29/24.
I will first bring your attention to the yellow and blue vertical lines, and the yellow channel that Adjust Alt Market Cap ran through four years ago and is running through again now. Quite similar, right?
Next you will notice the orange rectangle that began in August 2020 and ended in January 2021. This is shortly after Saylor began buying. BTC was sucking the market cap out of Alts because of Saylor + PayPal + ATH + PTJ/Druckenmiller/Etc. And ETH was sucking market cap out of Alts because of DeFi. So Adj Alt Dom collapsed to 16% at the bottom in January 2021 and then went on a truly breathtaking run of shitcoining. That period is in the purple rectangle. It was a period where DOGEBTC went up 6,000%. SOLBTC outperformed 2000%. BNBBTC outperformed by 400%. DeFi in aggregate grew $100bn. The list goes on. A proper Shitcoin Bonanza.
It was all over in May 2021 when Elon puked Tesla’s BTC and China banned crypto. It is noteworthy that Adj Alt Dom made a double top in September 2021, which was that wild late summer Alt Season after BTC bottomed so strongly in July 2021.
With the green line, I have projected out how it would look if we ran it back basically the exact same way as last cycle. Adj Alt Dom runs from here until this August, then massively collapses until Jan 2025, then goes on another breathtaking Shitcoin Bonanza until May 2025.
Aside from a potential BTC ATH pre-halving, part of the reason people are referring to the current price action as a “left translated cycle”, is because many are struggling to see how Adj Alt Dom could massively collapse from here in the coming months. The market, from what I can tell, strongly agrees with my “Lack of Pretense…” thesis and is acting accordingly. To say it differently, BTC price is already nearly back to prior ATH and Adj Alt Dom is currently at 29%, not 16%. Because of the ETF flows, BTC hasn’t needed to suck all that much market cap out of Alts in order to reach prior ATH.
Which naturally begs the question, will flows still trickle out of BTC into ETH, then large caps then small caps, like what happened in previous cycles? That’s a topic I’ll save for next month.
Closing Remarks
If you’ve been reading these, you know that in June I wrote –
“Frankly, we don’t deserve another bull market right now. We haven’t progressed nearly far enough from the mistakes of the last cycle. We don’t deserve another bull market when Changpeng Zhao continues to be the most powerful person in crypto. We don’t deserve another bull market with this much fraud. We don’t deserve another bull market without better regulations and better self-regulation practices. We don’t deserve another bull market with such flimsy token models. We don’t deserve another bull market without all that venture capital that went into crypto gaming producing a single game that has decent traction. We don’t deserve another bull market without smart contract platforms that fast, cheap and reliable.
So those are some of the changes I think we need to see as foundations for a sustainable, additive bull market. We might get a bull market before some or any of those materialize, and that would have me again worried about the sustainability of said bull market.”
Nine months later here we are, 10% away from BTC ATHs and a market that appears geared up to absolutely rip. Revisiting my list above, we crossed numero uno off. This is a great thing. We wouldn’t have ETFs if Changpeng hadn’t of been taken down and without the ETFs price wouldn’t be anywhere near where it is right now.
Barry Silbert is currently staring down the barrel of a $3 billion civil fraud charge from the NYAG and it looks like he’s prob guilty. Justin Sun is still hanging around and I believe represents the single largest “bad actor key man risk” to the space right now. It would be great if he was served a similar fate as Changpeng.
Our governmental regulatory framework is still lacking and while we may end up with some clarity from the resolution of SEC vs Coinbase, comprehensive crypto legislation is likely at least a year away. On the self-regulatory front, I see little tangible improvement (correct me if I’m wrong).
The token models are still flimsy. The points-airdrop daisy chain is creating a house of cards that will likely collapse at some point, even though it is likely to grow bigger first. Crypto gaming hasn’t produced anything compelling yet. We’ll likely get some amount of excitement around this in the coming quarters, but I’m not holding my breath on it being something sustainable.
At this point I’m not sure if we have fast, cheap reliable blockspace. Solana did have five hours of downtime this month. L1 and L2s in general haven’t seen enough of a spike in transactions to see what happens to the fees and uptime. We’ll likely get to see how that plays out later this year.
So, not exactly a resoundingly positive assessment of the current foundations of the crypto ecosystem, but it’s better than nothing. And if you read last month’s “A Lack of Pretense…”, you already knew this. By combining last month’s “A Lack of Pretense...” with this month’s “Financial Nihilism…”, you can see why I’m bullish on prices going up, at least for a while. Blow a bubble, pop a bubble. 3 up, 1 down.
“Continuance is power.”
– Japanese Proverb

Travis Kling
Founder & Chief Investment Officer
Ikigai Asset Management
P.S.
Included below is an incomplete list of memorable tweets from the last month. Twitter is not investment advice and my views could easily be wrong. That being said, like it or not, Twitter matters for crypto. I have no interest in being a talking head for a living and babbling about on Twitter is a long way away from being a good steward of investor capital. However, this is a community with open-source software in its DNA, and participants want to crowd-source the truth. We are shepherds of this technology. Answers to fundamental questions about this asset class are not currently clear, so having a public platform to share your views with the community is important. After all, you’re helping shape the future :)
1. Ikigai Asset Management is the trade name for a collection of advisory and consulting businesses operated by Travis Kling, Anthony Emtman, and their team.
The information contained or attached herein is not intended to provide, and should not be relied upon for, accounting, legal or tax advice or investment recommendations. This presentation may contain forward-looking statements that are within the meaning of Section 27A of the Securities Act of 1933 and Section 21E of the Securities Exchange Act of 1934. These forward-looking statements are based on management’s beliefs, as well as assumptions made by, and information currently available to, management. Although management believes that the expectations reflected in these forward-looking statements are reasonable, it can give no assurance that these expectations will prove to be correct. This email is for informational purposes only and does not constitute an offer to sell, or the solicitation of an offer to buy, any security, product, service of Ikigai as well as any Ikigai fund, whether an existing or contemplated fund, for which an offer can be made only by such fund’s Confidential Private Placement Memorandum and in compliance with applicable law. Past performance is not indicative nor a guarantee of future returns. Please consult your own independent advisors. All information is intended only for the named recipient(s) above and is covered by the Electronic Communications Privacy Act 18 U.S.C. Section 2510-2521. This email is confidential and may contain information that is privileged or exempt from disclosure under applicable law. If you have received this message in error please immediately notify the sender by return email and delete this email message from your computer. Copyright 2023 Ikigai Asset Management, LLC. All Rights Reserved.
NOT INVESTMENT ADVICE; FOR INFORMATION ONLY
PAST PERFORMANCE IS NOT A GUARANTEE OF FUTURE RESULTS
